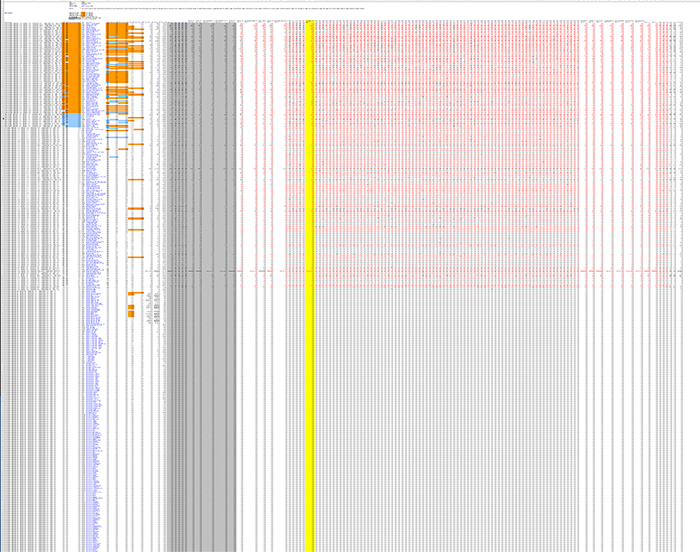
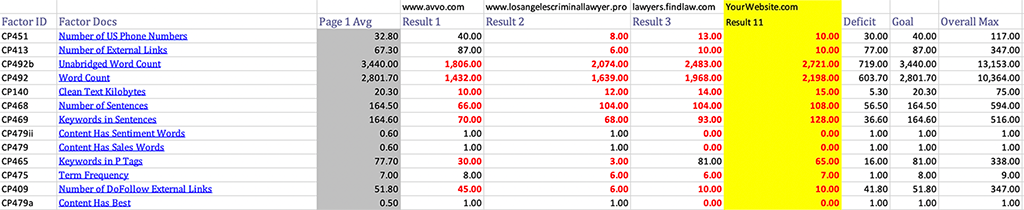
When we unhide all the measurement data in the overview sheet and zoom all the way out we can see the amount of data it takes to make the handful of recommendations that appear in the roadmap. In the overview each row is a different factor and each column in the red part is a different search result in the top 100 results from Google. The Yellow column is your tracked website. The dark gray band are the average factor measurements by page. The orange we see clustering at the top are the strong correlations. Seeing them grouped at the top tells us that the math we use to identify important factors is working.
Unlike on the other reports that display the keyword variations that Google makes bold in the search results, here they are in spintax format for use in other link building tools.

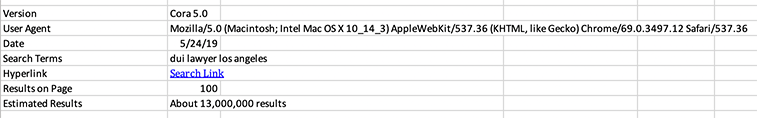
The meta data tells us when the data was collected. It provides a link the Google search result page. It tells us how many results were collected and how many Google estimates there are.
By default Cora hides most of the data it thinks you wont be interested in seeing. It does this to reduce the "overwhelm" that occurs when you see too much data at one time. By default Cora only shows the strongest correlating factors for your webpage and the top ranking webpages.
You will see gaps in the rows and columns identifiers. To unhide simply select across those gaps and then right click and select "Unhide" from the popup menu.

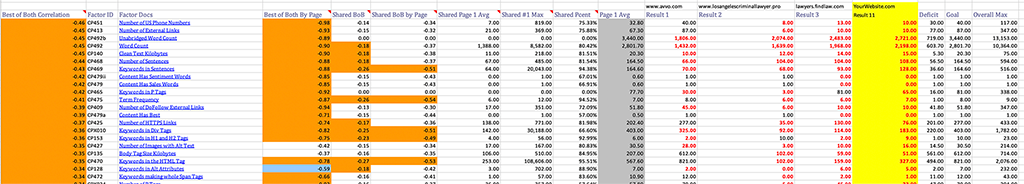
By default Cora tries to give you recommendations for what we call the Practical Maximum. The practical maximum for a factor is the largest meassure from results #1-3 or the page 1 average. Whichever of those 4 things is largest is the practical maximum. You can change this behavior by changing the deficit settings and selecting competitors at runtime. The practical maximum or your custom goal will appear in the Goal column.
The deficit is calculated by substracting your website's measurement from the goal. This deficits are exactly the same as the advice given in the Road Map. There is no magic. It is pure measurement and substraction to tell you how much you need to be competitive.
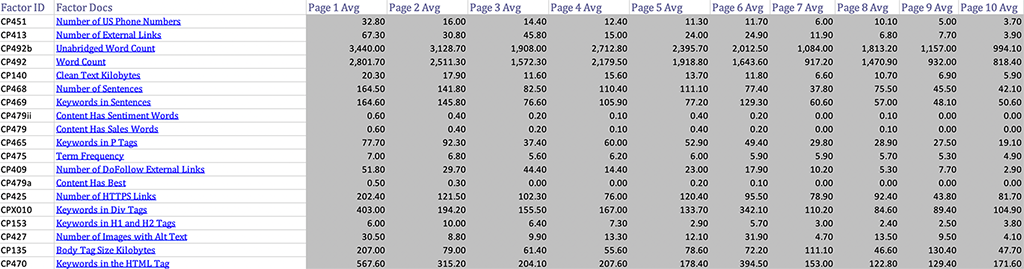
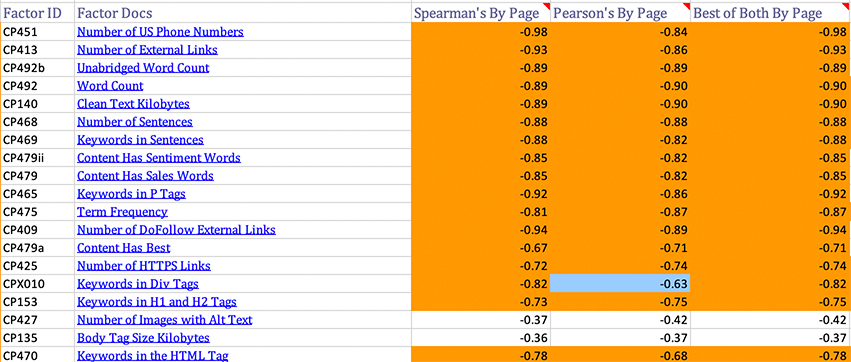
Generally you will only care about the average factor measurement on page 1 but we give you the average measurement by page for the top ten pages. You just have to unhide them.
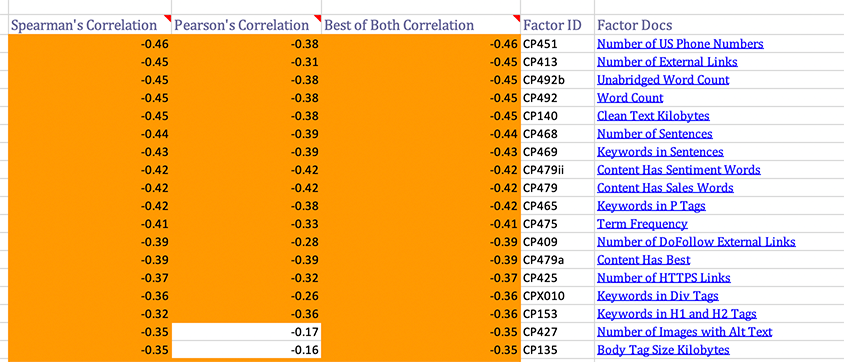
Cora uses both Pearson's and Spearman's correlation coefficients. These coefficients describe the slope of the trend line for each factor. So the quantify how much a factor appears to influence rankings. A.k.a. does it mathematically look like Google is sorting the results by this factor. Pearson's is better for correlating data that trends in straight lines. SPearman's is better at handling things that trend in curves. From one factor to the next we don't know how it will trend so we measure both and assume that the strong measurement is more appropriate for the factor, hence the "Best of Both" column. These coefficients range from -1 to +1. A value near 0 means the data appears random. A value near -1 means the more of the factor you have the better you tend to rank. A value near +1 means the more of the factor you have the worse you tend to rank. You really don't need to know all this. Just know that orange means it is worth of consideration if you have a deficit in that factor. The critical values show you what the correlation needs to be to be statistically significant for the sample size.
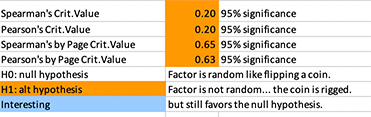
The first group of correlations is using all 100 meassurements for the factor and correlating against rank position in Google.
We also calculate the correlations of average measurement by page with page number in Google. This changes the sample size from 100 to 10 which is why there are different critical values.
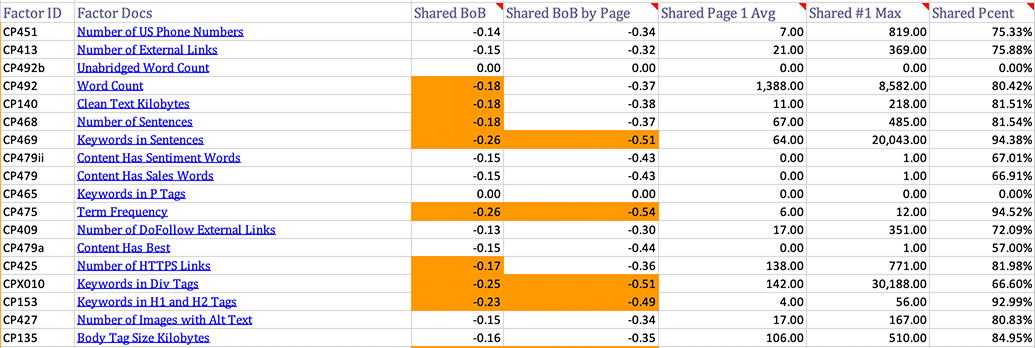
Lastly Cora uses can share anonymous factor data. That shared data appears in the shared columns so you can see how a particular factor is behaving across a large number of keywords. This helps you determine if a particular factor is only trending for this keyword of if it tends to trend in general.
- Shared Bob - Best of both correlation from the shared data.
- Shared Bob By Page - Best of both by page correlation from the shared data
- Shared Page 1 Avg - Page 1 average measurement from the shared data.
- Shared #1 Max - The maximum measurement found in the #1 spot from the shared data.
- Shared Pcent - This is the percentage of shared data keywords where this factor was a strong correlation.