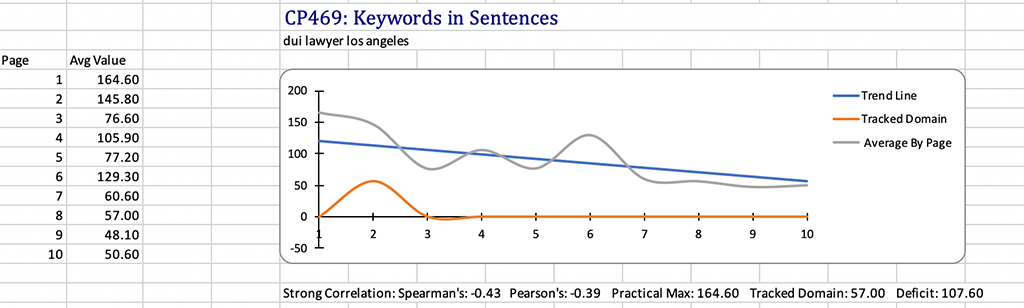
In each chart we see Page Number in Google on the X-Axis and the Average Factor Measurement By Page on the Y-Axis. The orange show use that we have a below average measurement for page 2 and we want an above average measurement for page 1. The blue line shows the correlation Cora meassured. The charts only work properly in excel.